
Thank you for your continued support and engagement. Each week, we're sharing what companies we're researching and the what, the who and the how that we think makes the companies interesting and unique. This roundup is brought to you weekly by a group of interns, creative minds, artists and investors who believe that through best in class investing along with the democratization of financial education we can do great things together. Enjoy, Explore and Share.

Equities fell this week as investors digested inflation data, geopolitical risks, and early earnings results. The Philadelphia Semiconductor Index officially entered a bear market on Friday as Chinese AI startup Moonshot unveiled its Kimi K3 model and geopolitical concerns weighed on the industry. The Kimi K3 model was reported to rival flagship LLM offerings from Anthropic and OpenAI, adding concern about risks to AI spending in the U.S. Geopolitically, the U.S. and Iran traded strikes for the 6th straight day on Friday, with escalation of targets on both sides. In his Thursday night primetime address, President Trump stated that the U.S. is “winning big in Iran, and you will see the fruits of that labor very, very shortly,” while Iran claimed that the U.S. would undo all remaining progress if the military goes ahead with threatened infrastructure strikes. The CPI and PPI reports for June were cooler-than-expected, taking some pressure off of the FOMC’s interest rate decisions, but a reignition of energy prices during the week offset some of the positivity of the reports.
In economic data for the week, the Consumer Price Index report for June showed inflation fell -0.4% MoM and cooled to 3.5% YoY. On a core basis, CPI rose 0.0% MoM and 2.6% YoY. Across metrics, CPI showed less pricing pressure than economists had estimated, driven by lower energy prices and few signs of a broadening out of price pressures. The June PPI report also was cooler-than-expected across metrics, falling -0.3% MoM and cooling to 5.5% YoY. Excluding food and energy, PPI rose 0.2% MoM and 4.7% YoY. The Retail Sales report for June was mainly in line with expectations, rising 0.2% MoM and rising 0.4% MoM excluding automobiles and gas. Initial Jobless Claims for the week ended July 11 were 217,000, compared with the consensus estimate of 208,000 and around the average reading so far in 2026. The preliminary July Consumer Sentiment report showed a significant beat on consensus expectations as consumers responded to falling gas prices and perceived more stable current economic conditions.
In company-specific news, TSMC delivered a blowout quarter with net income up 77% YoY, upwardly revised full-year guidance, and committed to another $100 billion in U.S. manufacturing capacity. The results show the AI buildout remains in full swing, but TSMC shares still came under pressure in the semiconductor selloff. AI sentiment was further impacted by a report that Google’s development of its new Gemini model underperformed internal targets, delaying its release. IBM triggered the company’s worst one-day share performance on Monday with a pre-announcement of Q2 2026 earnings, as management explained that results fell below their expectations during the quarter due to customers shifting spending away from software to AI hardware, absorbing the impact of higher memory pricing, and focusing on cybersecurity concerns in the quarter. Banks kicked off the earnings season this week, with bright spots in J.P. Morgan and Goldman Sachs results, driven by a surge in equities trading and a rebound in investment banking, signaling healthy capital markets activity. Netflix reported Q2 2026 results this week that led to an 8% selloff in shares on weaker-than-expected Q3 guidance and continued engagement concerns. Investors will look forward to another big week of earnings next week, with results coming from Alphabet, Tesla, Exxon Mobil, Intel, GE Vernova, Texas Instruments, American Express, T-Mobile, Verizon, Starbucks, ServiceNow, and more.
Friday’s Close (Weekly Performance)
S&P 500 7,457.69 (-1.55%)
Nasdaq 25,520.24 (-2.90%)
Dow Jones 52,146.42 (-0.93%)
Thank you Blue Room Senior Analyst JARED FENLEY.
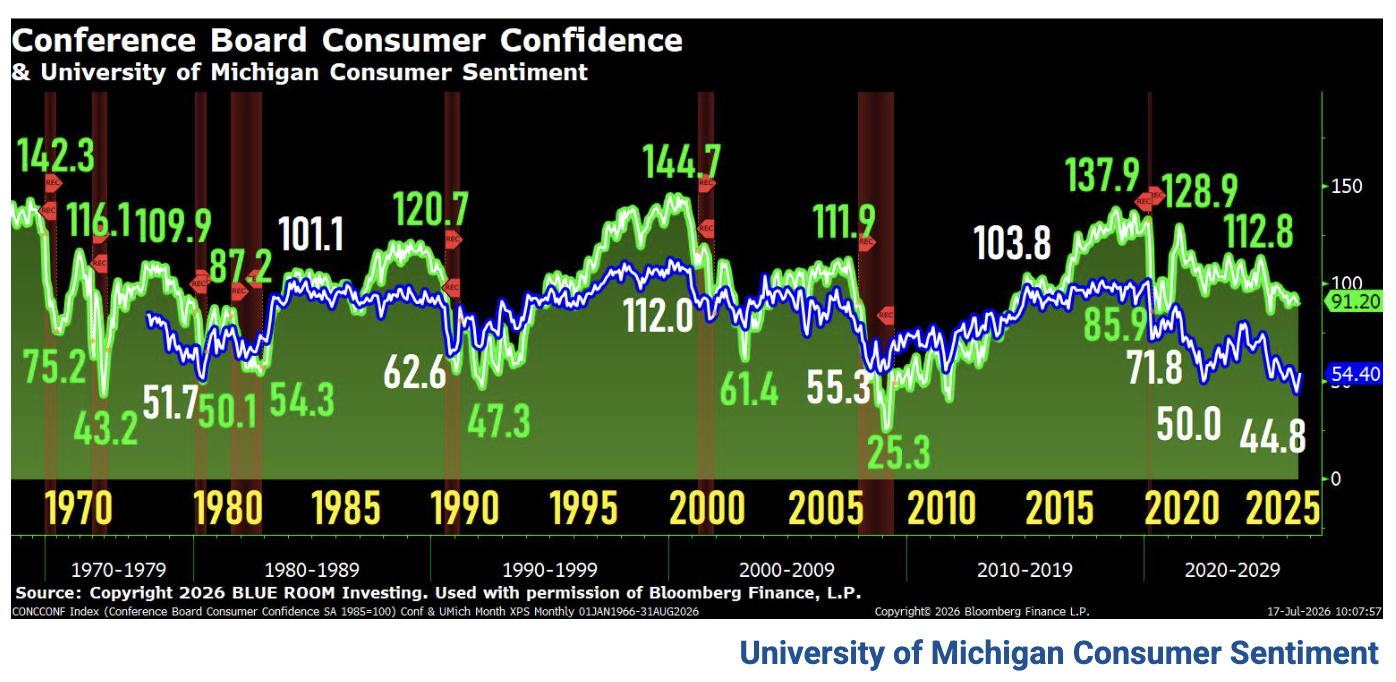
With the second straight month of 10% jumps, consumer sentiment climbed to 54.4 — its highest reading since February of this year on the basis of easing price pressures at the pump in recent weeks. All five index components improved, led by significant 20% increases in buying conditions for durables as well as year-ahead business conditions.
This month’s rise in sentiment was pervasive across the population, seen across groups by age, income, wealth, and political party. Particularly strong increases were seen among consumers without a bachelor’s degree.
However, with prices remaining frustratingly high, consumers are hardly ebullient about the economy — sentiment is down 12% from a year ago. Thus, sentiment’s upward momentum may prove difficult to sustain if recent declines in gas prices continue to reverse course.
Interviews for this release spanned June 23 to July 13, with more than 70% completed before the resumption of U.S. strikes against Iran on July 7 and the subsequent increase in gas prices.
Year-ahead inflation expectations ticked down from 4.6% in June to a still-elevated 4.2% this month. The current reading substantially exceeds the 3.4% seen in February before the Iran conflict began, along with all 2024 readings.
Long-run inflation expectations held steady from last month at 3.3%, remaining a bit higher than the 2.8% to 3.2% range seen in 2024.

2026 07 17 Economics Desk: Consumer Sentiment
Blue Room Investment Team Bullpen
Friday, July 17, 2026
Economics Desk: Consumer Sentiment
Disclosure:
This video is for informational purposes only and does not constitute investment advice.
David J. Rosa
Chief Executive Officer
Good afternoon, and thank you for joining us today. If Jamie's and my voices sound a bit different today, we're both recovering from head colds, so I appreciate you bearing with us.
Our performance in Q2 was solid. We saw continued global adoption across our multiport, single-port, and Ion platforms and steady execution by our teams. In Q2, total procedures increased 16%, driven by 15% growth in da Vinci procedures and 36% growth in Ion procedures. The global installed base of da Vinci and Ion systems increased by 12% and 21%, respectively, and we exited the quarter with almost 13,000 systems installed worldwide.
In the US, da Vinci procedure growth was 12%, led by general surgery, with after-hours procedures increasing 26%. Growth in the US moderated from recent trends and our expectations at the start of the year, predominantly in procedures that can be deferred. In our customer conversations, some have said that changes in patient coverage and premium dynamics may be affecting when patients seek care and move forward with treatment. Importantly, the underlying disease burden is unchanged, and deferred conditions typically progress and will ultimately require treatment. As patients return to care, we expect da Vinci will remain a clear choice for their surgeons and care teams.
Outside the US, da Vinci procedure growth was 20%. Regionally, growth was consistent, with Europe and Asia each up 20% and rest-of-world markets up 22%. In China, the environment remains challenging. We continue to see lower tender activity, increased domestic robotic competition and policy-driven pricing pressure, and we continue to operate through a dynamic policy environment, including charge code changes and the 15th Five-Year Plan quota process. We are engaging with provincial governments on their charge code policy and are progressing through the Green Channel process for both SP and da Vinci 5. When cleared, these platforms will bring additional differentiated capabilities to Chinese customers and their patients.
In Japan, new policies supporting robotic surgery went into effect on June 1st, including reimbursement for additional procedures and economic incentives for higher-utilization programs. We are encouraged by the direction of the policy environment as well as the early response to these initiatives.
India had another strong quarter, with momentum across a broad set of procedures. This week, we received da Vinci 5 clearance in India, and we're excited to bring our latest-generation platform to customers in that market.
Turning to systems. Q2 was a strong capital quarter, reflecting continued customer demand for our newer platforms and confidence in the value of our ecosystem. We placed 468 da Vinci systems and 55 Ion systems in the quarter. Within multiport, placements reflected strong adoption of da Vinci 5, including dual consoles, and continued demand for our fourth-generation systems, where their proven capabilities and value meet customer needs.

2026 07 17 BLUE ROOM: ISRG
BLUE ROOM Investment Team Bullpen
Friday, July 17, 2026
ISRG: Intuitive Surgical Q2 2026 by Jared Fenley
Disclosure:
This video is for informational purposes only and does not constitute investment advice.
Gunjan Kedia
Chief Executive Officer
Thank you, Brian, and welcome to our team. Good morning, everyone. Beginning on Slide 3, this quarter we delivered earnings per share of $1.35, an increase of approximately 22% year-over-year. Record net revenue of $7.7 billion highlights the strength of our diversified business mix and improved execution. Results in the quarter reflect strong progress against our three strategic priorities, revenue growth accelerated to 10.1% year-over-year. Expense discipline remains a hallmark for us, with 400 basis points of positive operating leverage this quarter. Our payments transformation is differentiating us and driving innovative client value propositions, especially for the Gen-Z and younger generations.
Importantly, we delivered these results while maintaining strong returns, credit performance, and capital levels. John will provide more details on our financial performance in his opening remarks.
Turning to Slide 4, fees rose to 44% of total revenue this quarter with both scale and quality of our fee mix driving high returns, stable earnings, and enduring relationships. Fee growth has steadily accelerated, and this is an important priority for us. While fee growth drives higher expenses, productivity initiatives helped improve our efficiency ratio and increased return on average assets.
Moving to Slide 5, the successful completion of the BTIG acquisition marks a significant milestone in our strategic build-out of Capital markets. In its first month as part of U.S. Bancorp, BTIG generated approximately $98 million of revenue, marking the strongest monthly revenue performance in BTIG's history and outpacing our earlier expectations from the deal. As integration progresses, we expect to capture more long-term strategic benefits of the combination. Our aim is to grow Capital markets to more than 10% of total company revenue over time.
On Slide 6, our payments franchise remains an important source of diversification and client engagement across the company. Total Payment Services revenue increased 5.7% year-over-year compared with 4.7% growth in the prior year quarter. While Merchant Processing growth slowed during the quarter, card issuing continued to perform well, and corporate payments saw a strong rebound driven by core demand and new business installations. We are increasingly managing these products holistically at the client segment level and investing to be competitive as this space evolves.
Turning to Slide 7, a consumer franchise is a source of strength for the company and an important driver of long-term relationships and lower-cost deposits. Given the increased interest we have seen in this space recently, we are spotlighting the strategy for the consumer franchise. We serve nearly 13 million consumers through a combination of digital and physical distribution, with approximately 18% residing outside of our traditional branch footprint today. In addition, we serve approximately 7 million customers through our card, co-brand, Elan, and partner platforms. Our co-products benefit greatly from this expanded scale. 42% of our consumer clients are now multi-service, up approximately two percentage points over the past two years. These relationships are more durable, generate higher return, and strengthen engagement over our franchise.

2026 07 16 BLUE ROOM: USB
BLUE ROOM Investment Team Bullpen
Thursday, July 16, 2026
USB: U.S. Bank Q2 2026 by Jared Fenley
Disclosure:
This video is for informational purposes only and does not constitute investment advice.
2026 07 14 Economics Desk: Small Business Optimism
BLUE ROOM Investment Team Bullpen
Tuesday, July 14, 2026
Economics Desk: Small Business Optimism
Disclosure:
This video is for informational purposes only and does not constitute investment advice.



10% OF ALL BLUE ROOM REVENUES GO DIRECTLY TO FUND OUR NON PROFIT TOGETHERISM.
WE CAN ACCOMPLISH ANYTHING TOGETHER.
These materials do not purport to be all-inclusive or to contain all the information that a prospective investor may desire in considering an investment. These materials are intended merely for preliminary discussion only and may not be relied upon for making any investment decision. Any discussion or information contained in this presentation does not serve as a receipt of, or as a substitute for, personalized investment advice from Blueroom or your advisor.
This publication does not constitute an offer to sell or a solicitation to buy any securities in any fund, market sector, strategy or any other product. Investing is speculative and involves substantial risks (including, the risk of loss of the investor’s entire investment). Past performance is not indicative of future results, and there can be no assurance that the future performance of any specific investment, investment strategy, or product will be profitable.
For more information about us and our general disclosures contact us directly.